PinnedLara Southard, PhDLevel up your data visualizations with Human Factors Principles of DisplayThis article explains the why behind many of the decisions we make when creating a good visualization.Jan 28, 2021Jan 28, 2021
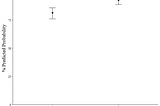
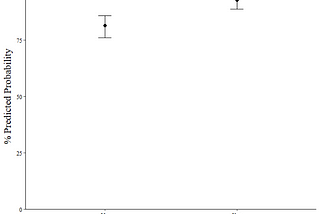
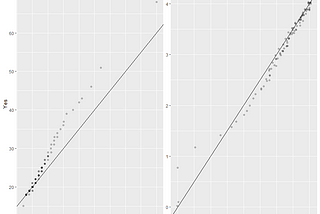
PinnedLara Southard, PhDVisualizing regression point-estimates in RYou can run your regression analysis (any variation) and then apply the following code:Dec 18, 2020Dec 18, 2020
PinnedLara Southard, PhDHow to Create Animated Lines and Labels in RI created an animated line graph with animated labels for a Data Viz Storytelling competition. The data included Denver eviction data from…Dec 18, 2020Dec 18, 2020
PinnedLara Southard, PhDinAnalytics VidhyaMatching samples for controlled analyses in RThis code is to show examples of different ways you can procure a matched sample for analysis using tidyverse. This information includes…Dec 18, 2020Dec 18, 2020
PinnedLara Southard, PhDinAnalytics VidhyaExcluding values in multi-column mean calculations in RThe TaskDec 20, 20201Dec 20, 20201
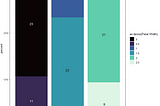
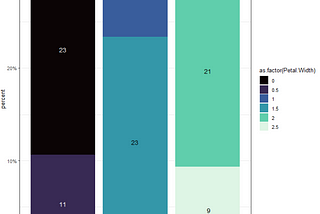
Lara Southard, PhDChanging geom_text color for stacked bar graphs in ggplot()I have run into the issue, where some labels aren’t showing up/are misplaced for stacked bar charts enough that I decided to document my…Jul 26, 2022Jul 26, 2022
Lara Southard, PhDinNerd For TechReplacing case_when() with joins in RI used to find myself writing hefty ifelse() or case_when() statement to recode values or create new columns — until someone told me to…Nov 15, 20211Nov 15, 20211
Lara Southard, PhDMigrating Libraries in R (process credit to RBloggers)I came across a really cool 3-step way to install all your old libraries in a new instance of R (be it a new device or if you update R)…Jul 1, 20211Jul 1, 20211
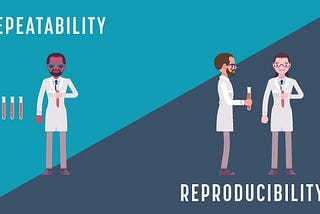
Lara Southard, PhDQuick tips for making reproducible code in RReproducible code should (at minimum) be your last step before closing out a project. You want someone (especially your future self) to be…Feb 10, 2021Feb 10, 2021
Lara Southard, PhDThe trick is in the kick — Swimming faster Part IIThis post is a branch of my previous post Becoming a better lap swimmer where I cover some distinctions between triathletes and swim team…Dec 21, 2020Dec 21, 2020